There are many things that may go wrong with your game development. Your models may have too many triangles for your target platform to handle, your algorithms may be too expensive for your CPU, and also you may be using too many materials so batching won’t work efficiently. These are difficult issues, and you as […]
Tag: Profiling
Mobile Optimization – Unity Profiler
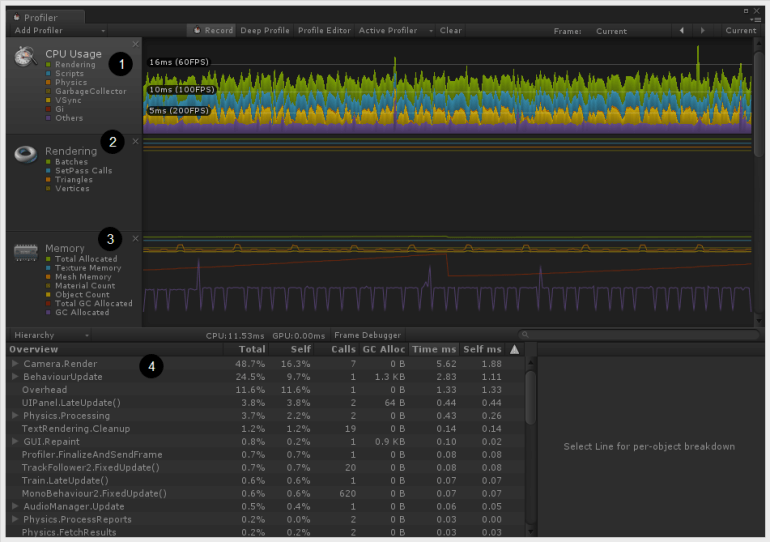
In the previous Mobile Optimization series post we talked about how important the batching is. We talked about how to use Unity Profiler in order to inspect how many batches are actually made. Now we will talk a little more about the Profiler itself. If you already know about it you may learn something new! The idea […]
Wrong Import Settings are Killing Your Unity Game [Part 1]
There are many things that may go wrong with your game development. Your models may have too much triangles than your target platform can handle, your algorithms may be too expensive for your CPU, and also you may be using too many materials so batching won’t work efficiently. These are difficult issues, and you as a […]
Mobile Optimization – Batching in Unity
Do you know what batching is? You may want to check out the Nvidia presentation Batch, Batch, Batch for some more details but long story short, batching the graphics data means to wrap it up into a single package and send it to the GPU in a single pass. Why does that matter to us? That’s […]
Profiling Unity Application with Profiler Samples
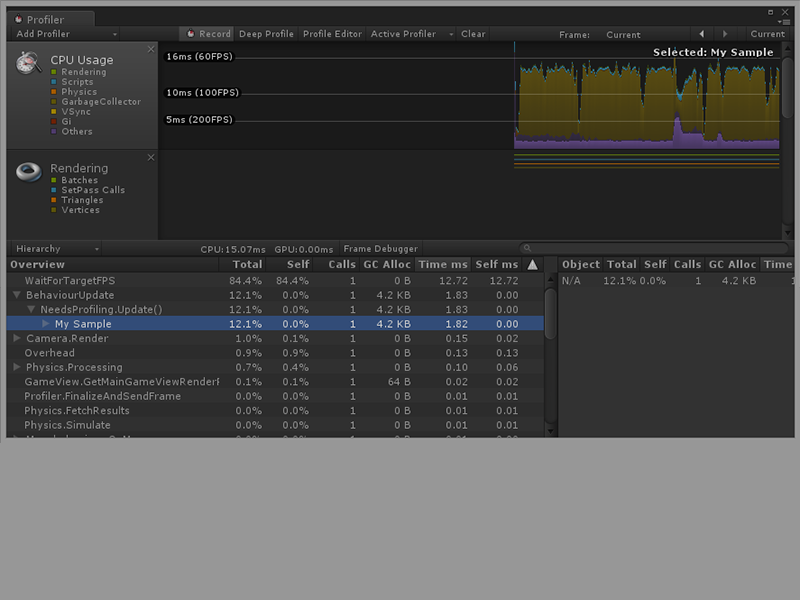
The Unity Profiler Samples is something that most of Unity users are unaware of. Yet it can be extremely helpful if you want to find out what amount of resources your code takes during the execution. If you’re already familiar with built-in profiler then you might know that by default it is not profiling all method calls. Also, […]