If you are only interested in metrics and you prefer skipping the entry on mobile games, please move to the end of the article! 🙂
Mobile Games Market
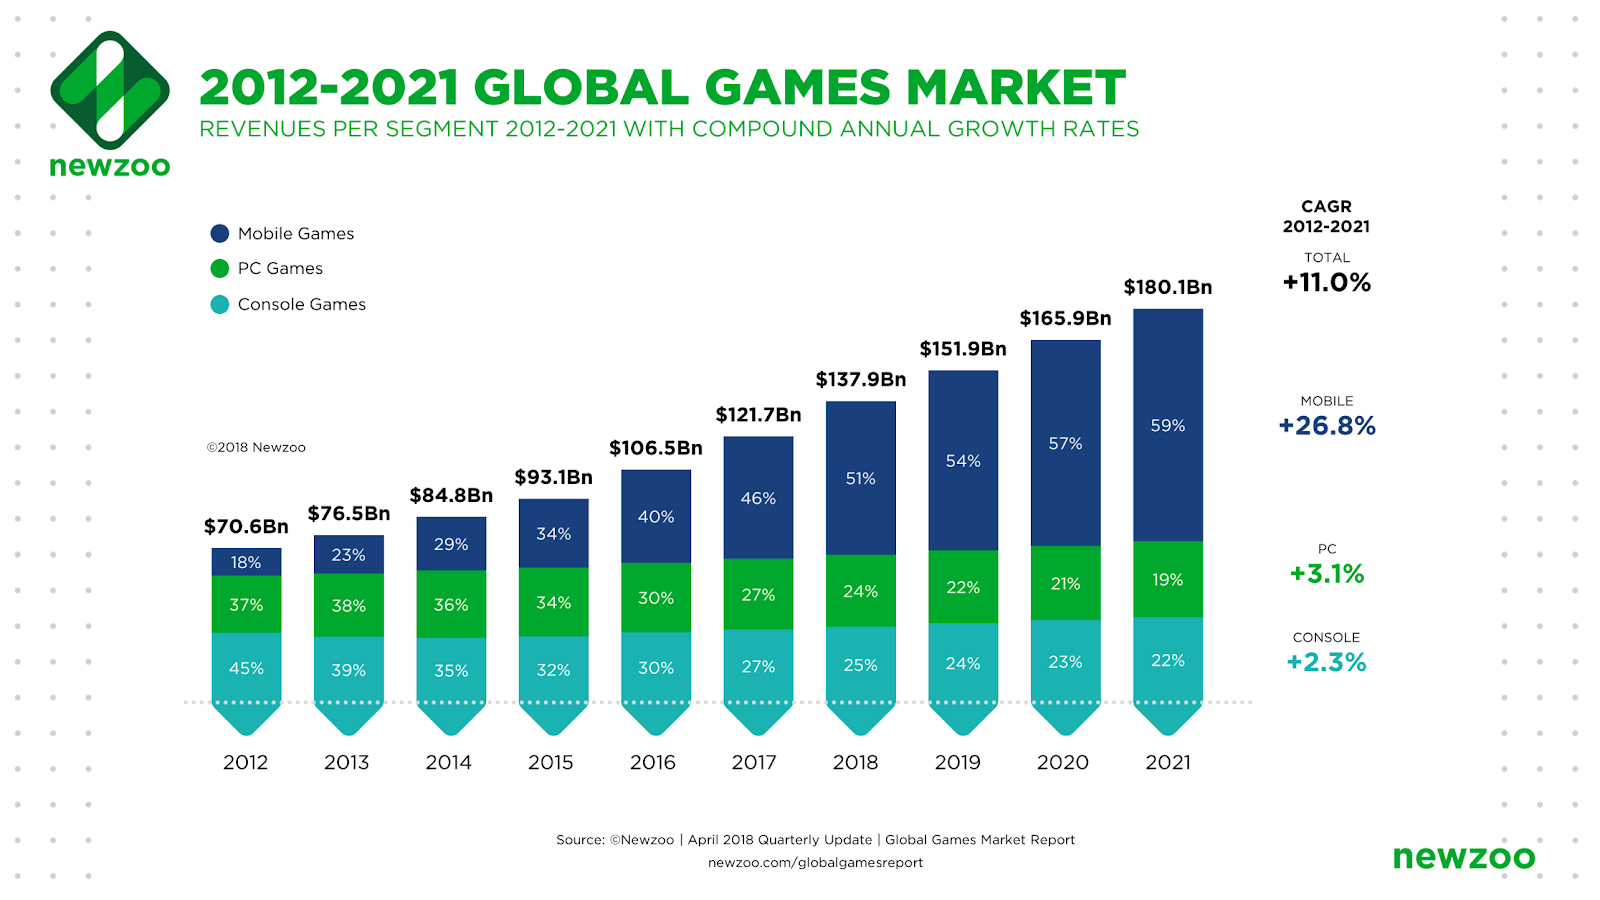
In 2019, about 2.4 billion people (~ 30% of humanity) played mobile games. Once again, mobile games made the greatest revenue for the gaming industry (54%), and by 2021, they are expected to hold almost 60% of the entire gaming market value.
Where do these crazy numbers come from? Currently, mobile games can be played by anyone in the world who has access to a mobile phone and Internet connection. But that’s not the reason. Some well-thought-out decisions and researched game design methods are behind it.
Mobile game designers form a very large community in the gaming industry. They are responsible for all kinds of metrics and analysis. Their tasks involve designing the logic and mechanics, balancing the game and much more. Very often, they also analyse statistics. They observe, e.g. which stage of the game the players have reached or how much money they have spent.
But how do they collect such data? How can we get it? And, most importantly, how to use it? We will find out shortly.
Mobile Game Genres
The game genre is determined based on gameplay and game characteristics. Very often, the genre affects the type of data we want to explore. Various genres also mean different business models.
Deconstruction of the genre is one of the most important things a designer must do when preparing to create a game. The ability to highlight the most important features and use the most profitable mechanics is key to achieving product success.
Currently, hyper casual is the genre where the workload to profit ratio is the most profitable. You can read about such games in my previous article.
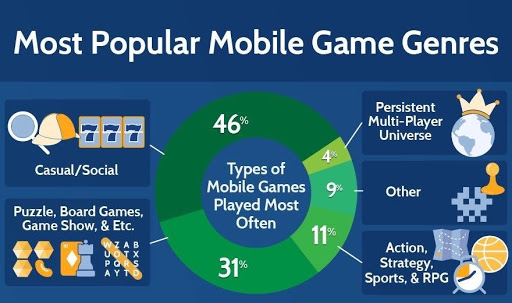
Source: Radical Labs, The Best Strategies for Successful Mobile Game Development
Monetisation in Mobile Games
Monetisation in mobile games is much more complex than the one in PC or console games. Here, we have many more parameters and ways to gain income, of which placing in-game ads is the most popular one.
We can distinguish 3 monetisation models in mobile games:
- In-app purchase-driven: a business model based on in-app transactions, involving mainly in-game currency, loot boxes and other amenities, made with the aim to accelerate the development of the character. It is often connected to the so-called “paywall” phenomenon, where game designers deliberately create the game in such a way that the user gets to the point where they are subconsciously forced to buy an upgrade/resource/premium account to make further progress.
- Ad-driven: a business model based mainly on making money from ads. An advertising banner is usually displayed throughout the entire game time, and every now and then a small on-screen advertisement (a so-called interstitial ad) is displayed to the user. This model includes also rewarded ads, which consist of 30 second videos or interactive advertisements. In return for watching them, the player gets some resources, e.g. health or mana points, soft or hard currency.
- Premium: a business model very similar to the one used in PC/console games. We pay once and we have access to all game content, usually without microtransactions.
Knowing how we can monetise our game, we need the right tools to maximize our profits. Let’s take a look.

Tools for Analytics
It would be very difficult to single-handedly measure from scratch such an amount of data divided into so many segments. That’s exactly why, we’ve got special tools! There are several very well-developed solutions for collecting and measuring user information coming from players who have downloaded the game. Each of the tools usually has a tutorial or guide, which makes its operation very easy!
Here are some of them:
- Game Analytics: one of the most popular tools for analytics and balancing player behaviour. It gives great possibilities for data personalisation and has a great design. It also deals with very advanced real-time behaviour studies!
- Unity Analytics: this is an official tool from Unity. It offers a lot of flexibility. We can use ready-made metrics, make a data comparison chart or add custom metrics, e.g. the number of people who defeated a given boss or completed a specific level!
- Firebase: Firebase is a mobile and web application development platform known for its very stable solutions that allow for measuring many different types of data at the same time, often offering higher limits than any other tool!
- AppsFlyer: a less popular but equally efficient tool for analytics and attribution. It serves for mobile applications in general, nor only games.

Fundamental Metrics!
We finally got here! These are the most important metrics in the mobile gaming industry with a short description 🙂
Retention (D1/D7/D30): the percentage of users who return to the application after the specific period of time. Common retention metrics are calculated based on 1-day, 7-day and 30-day periods. In practice, this is the most important parameter in game design. Publishers usually have guidelines indicating the required retention. If it is not reached, the game probably won’t be further developed. For example, Voodoo requires a 47% D1 retention, which means 47% of people who have installed the game have to return to it the next day.
Retention = (Number of People Who Logged in a Specific Period of Time / Total Number of Downloads) * 100%
![]()
LTV (lifetime value): the prediction of net profit for the entire game life cycle. It shows the estimated net value of future money flows from the specific user. It is generally very difficult to calculate LTV due to many factors that we often cannot even predict. This value also shows how much money should be spent on development and marketing. There are a lot of formulas for calculating LTV. I will give you the simplified one because explaining the extended formula would take a whole separate article.
LTV = (Average Revenue Per User / Churn Rate) – Cost Per Acquisition
![]()
CPI / CPU (cost per install / cost per user): this is the price for a new user based on paid advertising. CPI is often used to check the profitability of a project campaign. This metric only relates to paid installs. You can draw a lot of conclusions from it, e.g. if the CPI is higher than LTV, it means that the product is not profitable.
CPI = Total Advertising Expenditure / Total Amount of Downloads
![]()
Custom events: custom events are those that we define ourselves in the selected tool. These are unique game-specific events, although we often use the same or very similar patterns as in other productions. Event parameters play a very important part here as based on them, we are able to perform data analyses. These metrics check for example which level we were while killing the third boss, how many HP we had, what weapon we used, what armour we had, was it a team effort or not, did we have a premium account or not, etc. Custom events can be very complex and include several dozen parameters, although this requires a lot of data analysis. Most of the time, 10 parameters per event should be enough. There is no formula for a custom event, so you have to think about it on your own.
![]()
Organic installs: organic installs occur when users decide themselves whether a game is worth downloading or buying. These downloads are not linked to any installation source (e.g. advertisement). It is believed that organic installs are connected with the so-called free advertising. For example, promoting a game on your social media can boost the number of organic installs. Some people promote their game via mailing lists or other free sources. Organic installs are also counted when the game is downloaded straight from the search engine.
![]()
Non-organic installs: non-organic installs are downloads that have been made following various types of marketing activity. These downloads are considered paid. This means that the advertising campaign attracts new users.
![]()
CPA (cost per acquisition / action): this metric shows us the cost of user action (conversion), e.g. downloading the game, clicking on the ad or making an in-app purchase. It’s a great thing because it grants us the ability to pay for a direct result and easily compare performance across channels.
CPA = Total Cost of a Campaign / Number of Conversions
![]()
CTR (click-through rate): the percentage of people who click on an ad. This is a method of measuring the success of an advertising campaign. The higher the CTR, the more effective the ad unit. CTR may vary depending on the popularity and clickability of the ad unit.
CTR = (Total Clicks / Total Impressions) * 100%
![]()
ARPU (average revenue per user): a metric that allows you to measure the average revenue generated on one player. ARPU will vary greatly depending on the game genre — for certain genres ARPU can be up to 50 times higher than for others.
ARPU = Total Revenue / Total Number of Users
![]()
ARPPU (average revenue per paying user): a metric that is used to estimate the average amount of money spent by players. Only those who have made at least one transaction are taken into consideration for this metric. A vast majority of players prefer F2P model, so they do not spend any money (advertising revenue does not count). This is an important note: if you plan an ad-driven game, then probably this metric will be useless for you.
ARPPU = Total Revenue from Paying Users / Total Number of Paying Users
![]()
ARPDAU (average revenue per daily active user): a metric that allows you to measure the daily success of your game. It allows you to accurately check in-game behaviours every day and measure the average revenue per daily active user.
ARPDAU = Daily Revenue / Daily Active Users
![]()
DAU (daily active users): the number of users who have launched the application at least once in a given day. DAU is very often used in combination with other metrics (e.g. ARPDAU). It mainly aims to measure whether the popularity of your game keeps growing, drops or just stays the same.
![]()
WAU (weekly active users): the number of users who have launched the application at least once in a given week. Most often used in DAU/WAU or WAU/MAU ratios.
![]()
MAU (monthly active users): the number of users who have launched the application at least once in a given month. Often used to measure “stickiness” of the game.
![]()
CPM (cost per mille): a metric that determines the cost of reaching a thousand users. If the CPM is $10, it means that 1000 views cost $10.
CPM = (Total Campaign Advertising Cost / Total Impressions) * 1000
![]()
eCPM (effective CPM): eCPM is used to assess the revenue from the product. It’s the revenue from 1000 impressions. If the eCPM is $1, it means that 1000 ad unit views generate $1.
eCPM = (Total Revenue / Total Impressions) * 1000
![]()
ROI (return on investment): a metric that will help you find out if the current state of investment meets your expectations. Very often used to increase investment efficiency or compare it to other investments.
ROI = (Net Profit / Total Investment) * 100%
![]()
Conversion: in other words, it is an action caused by the advertising campaign. It can mean downloading the game (in the case of new users), but also buying an in-game product, etc.
Impression: in other words, it is simply the number of ad views. Even if the ad was not clicked on, its viewing counts as an impression.
![]()
K-factor: a metric used to determine the growth rate of the game. If K-factor is 1, it means the game does not grow, if less than 1, it loses players, and if more than 1, it means that it gains in popularity.
K-Factor = Invites Sent by Each User * Conversion Percentage of Invites
![]()
Sticky factor: a metric that determines the engagement of players. It’s just the MAU/DAU ratio, which shows us how large groups of players enter the game and how often do they do it. The higher the percentage, the greater the players’ engagement.
Sticky Factor = Monthly Active Users / Daily Active Users
![]()
Segment: a group of users who share similar characteristics. It is about categorising users according to various criteria that determine their in-game behaviours. For example, if there is a segment of players who are engaged or spend a lot of money, you can give them a special offer for an item. Market segmentation is one of the most important things you need to consider when developing your game. This can help a lot in increasing player engagement.
![]()
Funnel: this metric allows you to see and measure a player’s path. It’s mainly about checking which stages of the game the players have completed, and at which stage their adventure with your application was on average ending. A well-done funnel can show you which stages of the game are possibly buggy or too grindy. It is also a great way to improve retention and conversion.
![]()
Churn rate: this metric helps you measure the number of users who are leaving your game at a specific period of time. This is one of the most important pieces of data that is needed to calculate LTV.
Churn Rate = (Users Who Have Left / (Users at the Beginning of the Period + New Users during the Period)) * 100%
![]()
ANoSPDAU (average number of sessions per daily active user): the higher the number, the greater the players’ engagement in a very short period of time. It determines how many sessions per day users play on average.
ANoSPDAU = Total Sessions / Daily Active Users
![]()
Total daily play time: total time in seconds that the players devote to playing your game.
![]()
Whale (spenders): these are the players who have spent a lot of money on your game. Usually, it is less than 1-2% of all users. Companies tend to rank the players, and the threshold to be considered a whale is usually $100 / month.
![]()
Minnow (spenders): these are the players who have spent on your game the smallest amounts possible, usually around $1 / month.
Summary
That’s it. These are the basic metrics that every game analyst and mobile game designer should know and use with ease.
I would be very grateful for your feedback.
Thank you for your time!