In the previous Mobile Optimization series post we talked about how important the batching is. We talked about how to use Unity Profiler in order to inspect how many batches are actually made. Now we will talk a little more about the Profiler itself. If you already know about it you may learn something new!
The idea
The idea behind the Profiler is to provide as much timing, memory, and statistical information as possible. You can learn:
- how long your game needs to compute and render a frame
- What takes so long? (scripts, physics, graphics etc.)
- the cause of spikes (short moments when your game fps is dropping)
- what is generating garbage
- how much memory the game allocates
- and many more…
To access all this data you need to:
- Open the Profiler window from Windows -> Profiler main menu.
- Make sure that the Record button is enabled.
- Press the Play button and pause (or disable the Record button) when you want to analyze the collected data.
Note that it’s highly recommended to profile your game on target platform rather than in the Unity editor. You can do so by building a Development Build and by selecting Autoconnect Profiler in the build window. Although the second is not required, it will automatically start the profiling when the game is launched.

Be aware that you’re required to own Android Pro or iOS Pro licenses to profile on Android or iOS platforms.
Deep look onto the Profiler Window
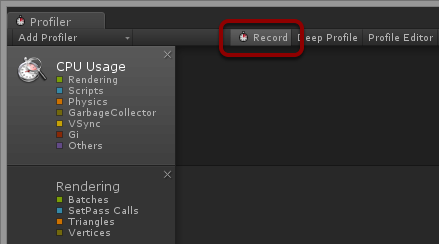
Let’s have a look at the Profiler window. You will learn everything that you need to know from the Unity manual, but we will now look at some part of it.

- 1-3 are categories of profiling methods. There is more, but these three will be the most interesting. The first one is CPU Usage. Here you will learn the total time needed for your frame to compute and render. Times are categorized to Rendering, Scripts, Physics, etc.
- Rendering category shows you information about Batches, SetPass Calls (formerly draw calls), Triangles and Vertices count.
- Memory category informs you about memory statistics. Be sure that your game is not consuming too much!
- This is CPU usage profiling section. Here you will find a lot more information about theUnity internals and your own scripts performance. This is information only about a single frame, so you have to click anywhere on the graph to select a frame. By default you’re able to expand some method calls only to level 1; enable Deep Profile (button at the bottom) to browse the script calls more deeply. Be careful with deep profiling. It requires a lot of memory and it makes your game run significantly slower.
The spikes
Let’s talk about spikes. This is usual term for situations when your game fps is significantly dropping for a split second. Why this is called a “spike”? That’s because in Profiler it looks just like a spike standing out the ground.
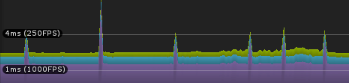
Spikes are telling you that something caused, in this exact moment, that your frame is computed longer than usual. And you should inspect it.
I will list most known cause of spikes:
Garbage collector
If you know .NET platform well enough then most probably you’re aware of the garbage collector. If you don’t, imagine that all the memory that is allocated by your game at the runtime must be freed at some point, and this is also done at the runtime. This process is called garbage collection and it freezes your game until it is finished. Usually it can take only a fraction of a second, but this is more than enough to make your game feel laggy and unpleasant. The only way to target this issue is to prevent garbage collection from happening. We will look deeper into this matter in another blog post.
GameObject.Instantiate()
Instantiating objects during the game is one of the most expensive operations. When you’re instantiating an object, you are instantiating all its children including all the components. All script components requires to be properly initialized. This is easy way to generate quite a large spike.
To prevent this from happening, learn about object pooling. Simply talking you need to instantiate all possible needed objects at the beginning and hide them until needed. There are some pool scripts on the asset store that will help you handling that issue.
Scripts and expensive algorithms
Sometimes spikes will be generated by your own scripts. Maybe you’re doing too expensive operation that could be optimized or should be done in separate thread.
This kind of spikes are usually the easiest to fix, but most probably you will need to enable Deep Profile mode to make the Profiler to generate more information about your scripts performance. Many algorithms may be optimized. Those that cannot may be executed in coroutines or separate threads. Be aware that if you will decide to move your code to a separate thread, you shouldn’t call Unity API from within that thread. Instead you should use components like Dispatcher from UnityToolbag that will dispatch Unity API calls to the main thread.
Background processes and operating system itself
Sometimes you may experience spikes that are not your game’s fault. These spikes are displayed with a large amount of time assigned to Other category. This can be seen on operating systems that are allowing too many apps to run in the background (desktop operating systems or Android). This is not something that you can do about it, so kill as many background apps as possible, keep your Profiler open and observe if the spikes will go away. You can always try profiling it on a different device.
More tips
Mobile optimization is such a broad topic that it cannot be exhausted in a single blog post. Keep watching for new blog posts tagged with Mobile Optimization tag. There will be more! Next time we will talk about garbage collecting!