Unity Inspector is extremely useful tool when it comes to tuning up your game objects and components. By default, the inspector is displaying only public and serializable fields, but sometimes you may need to know more about your objects state.
You may want to include Debug.Log() function calls in your code. Usually, this is the fastest way of debugging things. Yet there may be a quicker way!
Consider following script:
using UnityEngine;

public class Counter : MonoBehaviour {
    public bool count = true;
    private float time;

    void Update() {
        if (count) {
            time += Time.deltaTime;
        }
    }
}
This script does nothing more than adding the Time.deltaTime value to a private time field. It’s done under one condition – when the count field is set to true (by default, it is).
When this script is added as a Component to any game object, its inspector looks like this:
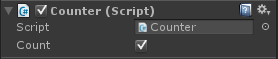
Nothing surprising here. We can see the Script property which is a common field for all components that are scripts, and the Count property that is bound to the count field because we have set that as a public field.
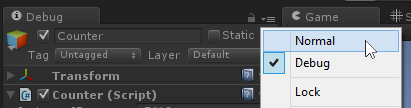
Now, if we would like to debug this component, we can use Debug.Log() function as previously mentioned, but it will result in significant amount of log entries in the Console. The better way to do this might be switching the Inspector into the debug mode. Here’s how to do it:
As you can see, the debug mode has changed the Inspector look dramatically. If any component had custom rendering code, debug mode would disable it.
An interesting fact is that the debug mode is revealing scripts’ private fields as it did with the time field from our script:
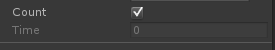
For security reasons it is not editable, but still it displays the current value set to the time field. Let’s verify that:
When you’re finished, you can switch your Inspector back to normal mode by clicking again in the top-right corner and selecting the Normal option: